Take Control of Your Data with Dashboards
The future of analytics is flexible. With Dashboards in Aditude Insights, you decide how your data is displayed, analyzed, and acted upon—no code, no compromises.

A Better Way to Work with Data.
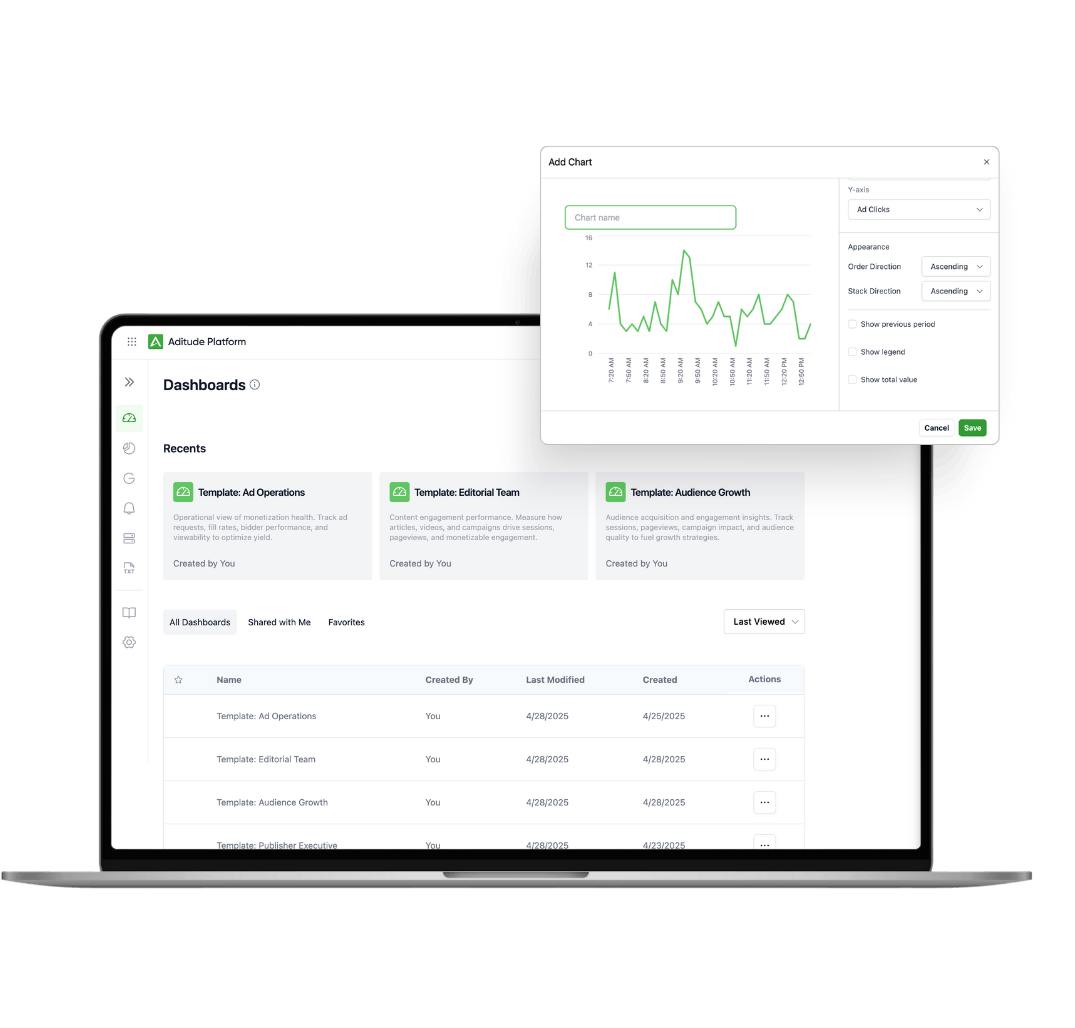
Create and save multiple dashboards, each designed for specific roles, use cases, or performance goals.
Choose from a range of charts and tables to present your KPIs exactly how you want—no developer required.
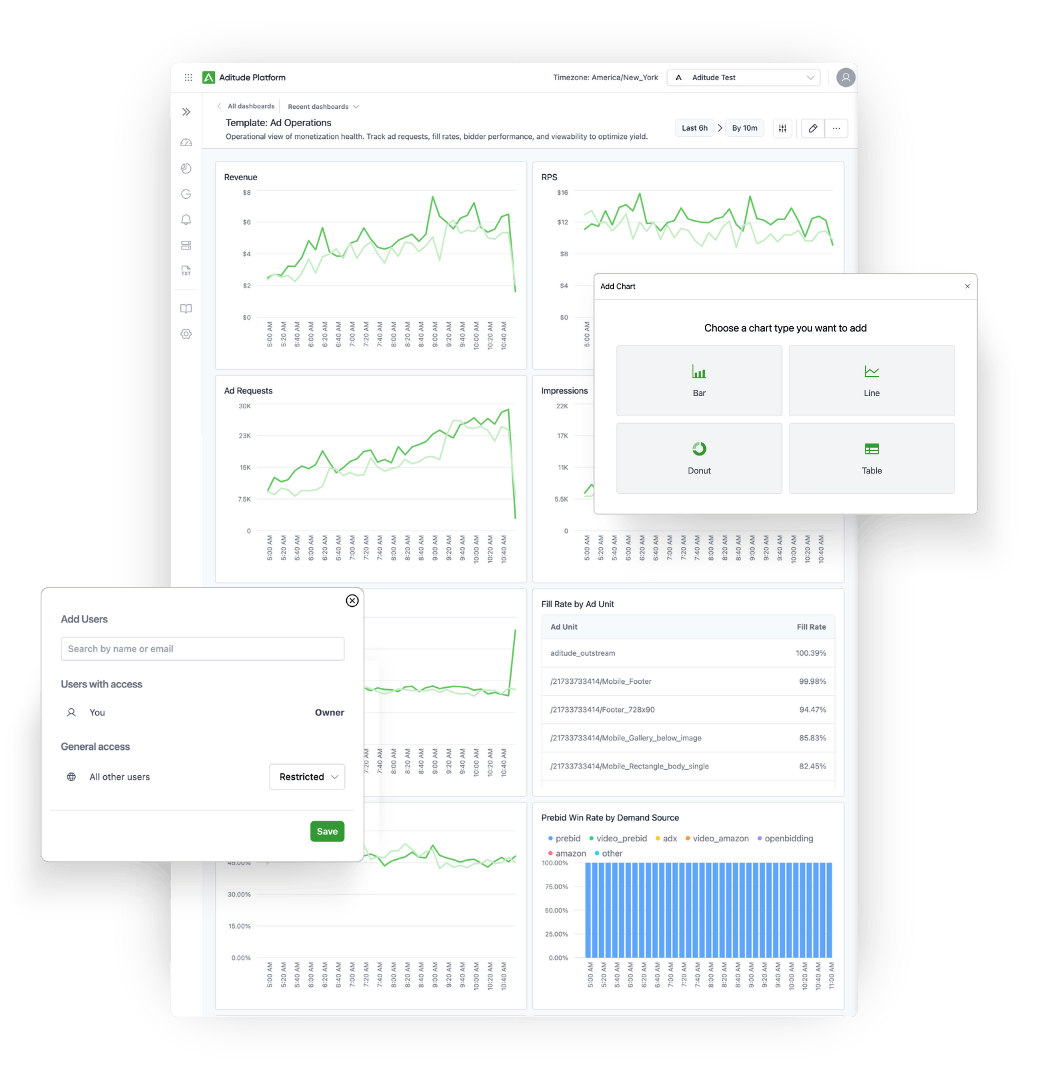
Track live metrics across dashboards without rerunning queries or resetting filters.
Easily share dashboards across teams and stakeholders for faster alignment and better decision-making.
Built for Flexibility
Drag-and-Drop Editor: Customize layout with a simple drag-and-drop interface. Resize modules, reposition charts, and organize your workspace for maximum clarity.
Multi-Dashboard Management: Build dashboards by department, project, or campaign—and switch between them instantly.
Persistent Filters & Views: No more starting from scratch. Your filters and configurations persist, so you can pick up right where you left off.
Customizable Widgets: Choose from line charts, bar graphs, donut charts, and tables. Apply dimensions and metrics that matter to you.

Templates Designed for Your Team
Use Case | |
|---|---|
| Ad Ops | See an operational view of monetization health. Track ad requests, fill rates, bidder performance, and viewability to optimize yield. |
| Executive | Monitor high-level overview of revenue, RPS, and audience trends to support strategic business decisions. Focused on overall financial and performance KPIs. |
| Editorial | Find out how content is performing. Using custom parameters and UTMs, discover how articles, videos, and campaigns drive sessions, pageviews, and monetizable engagement. |
| Audience Growth | Dive into audience acquisition and engagement insights. Track sessions, pageviews, campaign impact, and audience quality to fuel growth strategies. |
Ready to Level Up Your Ad Strategy?
Discover how you can leverage Dashboards for your team. Let us help you transform your ad strategy and maximize your earnings.
