How to Identify Which SSPs Are Underperforming
The Aditude Team
Most publishers know when something feels off with a demand partner — revenue dips, fill seems inconsistent, a specific SSP just never seems to win. But instinct isn't a process. Without a repeatable, metric-based evaluation framework, you're either removing SSPs based on gut feel and possibly losing real revenue, or tolerating genuine underperformers because you can't prove the problem.
Here's a data-driven method for evaluating your SSP stack. Run it quarterly, or any time revenue moves unexpectedly.
Step 1: Pull the Right Metrics for Each SSP
Before you can compare SSPs, you need consistent data across five core dimensions.
Bid rate is the percentage of eligible auctions where the SSP submitted a bid. A low bid rate means the SSP is passing on a significant portion of your inventory — most often because their buyers don't want your audience, or your floor prices are above what they'll pay.
Win rate is the percentage of auctions where the SSP's bid was highest. An SSP can have a high bid rate and a low win rate, meaning they're participating but consistently losing to other partners. Low win rate alone isn't disqualifying — it may just reflect competitive pressure — but it matters when combined with other signals.
eCPM is effective revenue per thousand impressions from that SSP's wins. This measures bid quality, not bid frequency.
Fill rate contribution is what share of total filled impressions this SSP is responsible for. An SSP winning 40% of your impressions has a fundamentally different role in your stack than one winning 2%.
Bid response time is average latency from auction request to bid response. Slow responders eat into your timeout window and reduce effective competition even when they're technically submitting bids.
Most SSPs expose these metrics in their reporting interfaces. The challenge — addressed in Step 3 — is that they don't all define or report them the same way.
Step 2: Normalize for Fair Comparison
Raw SSP metrics pulled from individual dashboards aren't directly comparable. To get an apples-to-apples evaluation, control for three variables.
Same time window. Pull data from the same date range for every SSP, ideally 14–30 days. Short windows introduce noise; anything over 60 days can obscure recent changes. If you're investigating a specific revenue anomaly, anchor the window around when the change occurred.
Same inventory segments. Different SSPs often run on different placements. An SSP configured only for desktop will look very different from one running across all devices. Segment by placement, device type, and geography before comparing — or filter down to a shared segment where all SSPs compete on equal footing.
Net revenue, not gross. Some SSPs report gross revenue; your actual take-home is net of revenue share. Comparing eCPMs without normalizing for revenue share means you're comparing the wrong numbers. Apply each SSP's revenue share rate to get to net eCPM first.
Skipping normalization is where most informal SSP evaluations go wrong. An SSP looks like it's underperforming when it's actually just configured differently or operating in a different inventory segment.
Step 3: Know What Thresholds Signal a Real Problem
Once you have normalized data, flag the following.
A bid rate below 30% on inventory segments where other SSPs are bidding at 60%+ is a meaningful gap. It usually means the SSP's demand isn't aligned with your audience or content categories, or that your floor prices are above what their buyers will pay.
A win rate near zero (under 3–5%) over 30 days suggests the SSP is participating without contributing. They're adding latency to your auctions with minimal revenue return. This doesn't automatically mean removal — a low-win-rate SSP might still be adding incremental competitive pressure that pushes other SSPs' bids up — but it warrants scrutiny.
An eCPM more than 30% below your stack average for the same inventory segment, sustained over multiple weeks, indicates the SSP's buyers aren't valuing your inventory competitively. Occasional dips are normal; persistent underperformance at this scale is a structural issue.
Bid response time above your auction timeout is a hard problem. If your timeout is 300ms and an SSP is averaging 380ms, their bids are never being counted — they're adding network overhead with zero revenue contribution. This shows up as a high bid rate but zero impressions won.
Fill contribution under 1% for an SSP that's been in your stack for 60+ days likely means they're not meaningfully contributing to your revenue. The question becomes whether the latency cost of keeping them in the auction outweighs any incremental competitive pressure they add.
Step 4: Account for Seasonal and Category Effects
Before acting on underperformance signals, rule out contextual factors that legitimately skew comparisons.
Seasonality. Programmatic demand compresses in Q1 and August, and spikes in Q4. An SSP that looks weak in February may be performing appropriately for market conditions. Compare against the same period in prior years, or against your overall stack trend rather than an absolute eCPM target.
Content category. Some SSPs index heavily on specific verticals — finance, automotive, B2B. If your traffic mix shifts (a viral article in a category an SSP doesn't buy well), their metrics will temporarily drop with no change in their underlying platform performance. Segment by content category before drawing conclusions about SSP quality.
Geography. Most SSPs have stronger demand in certain markets. An SSP with excellent US fill may have minimal demand for your EU or APAC inventory. If you're evaluating a global publisher, geographic breakdowns are essential — sitewide averages mask real strengths and weaknesses.
Step 5: Decide What to Do With an Underperformer
Not every underperforming SSP should be removed. The right response depends on what the data shows.
Optimize first. If bid rate is low but the SSP has strong eCPM on the inventory they do win, the problem may be configuration — floor prices set too high for their demand mix, missing category mappings, or stale targeting parameters. Contact your SSP partner and review the setup before making structural changes.
Adjust position in the mediation waterfall. If you're using a waterfall rather than a unified auction, an SSP with slow response times should be moved lower in the sequence so faster responders get priority. This preserves any incremental revenue contribution without penalizing your auction latency.
Reduce or remove. If an SSP has low bid rate, near-zero win rate, and below-threshold eCPM — and you've ruled out configuration issues and seasonal factors — they're a candidate for removal. Before removing, run a 7–14 day test with them paused to measure the revenue impact. Removing a low-performer sometimes has no effect on total revenue; occasionally it reveals they were providing competitive pressure you can't easily replace.
Keep with monitoring. If an SSP's underperformance is recent and coincides with a market event or a platform update, put them on a 30-day watch period before acting. Premature removal based on a short anomalous window is one of the most common avoidable mistakes in demand stack management.
Step 6: Use Unified Analytics, Not Individual SSP Dashboards
Running this evaluation manually — logging into each SSP's dashboard, pulling exports, normalizing in a spreadsheet — is the reason most publishers don't do it consistently. It takes hours per evaluation cycle, and normalization is where errors accumulate.
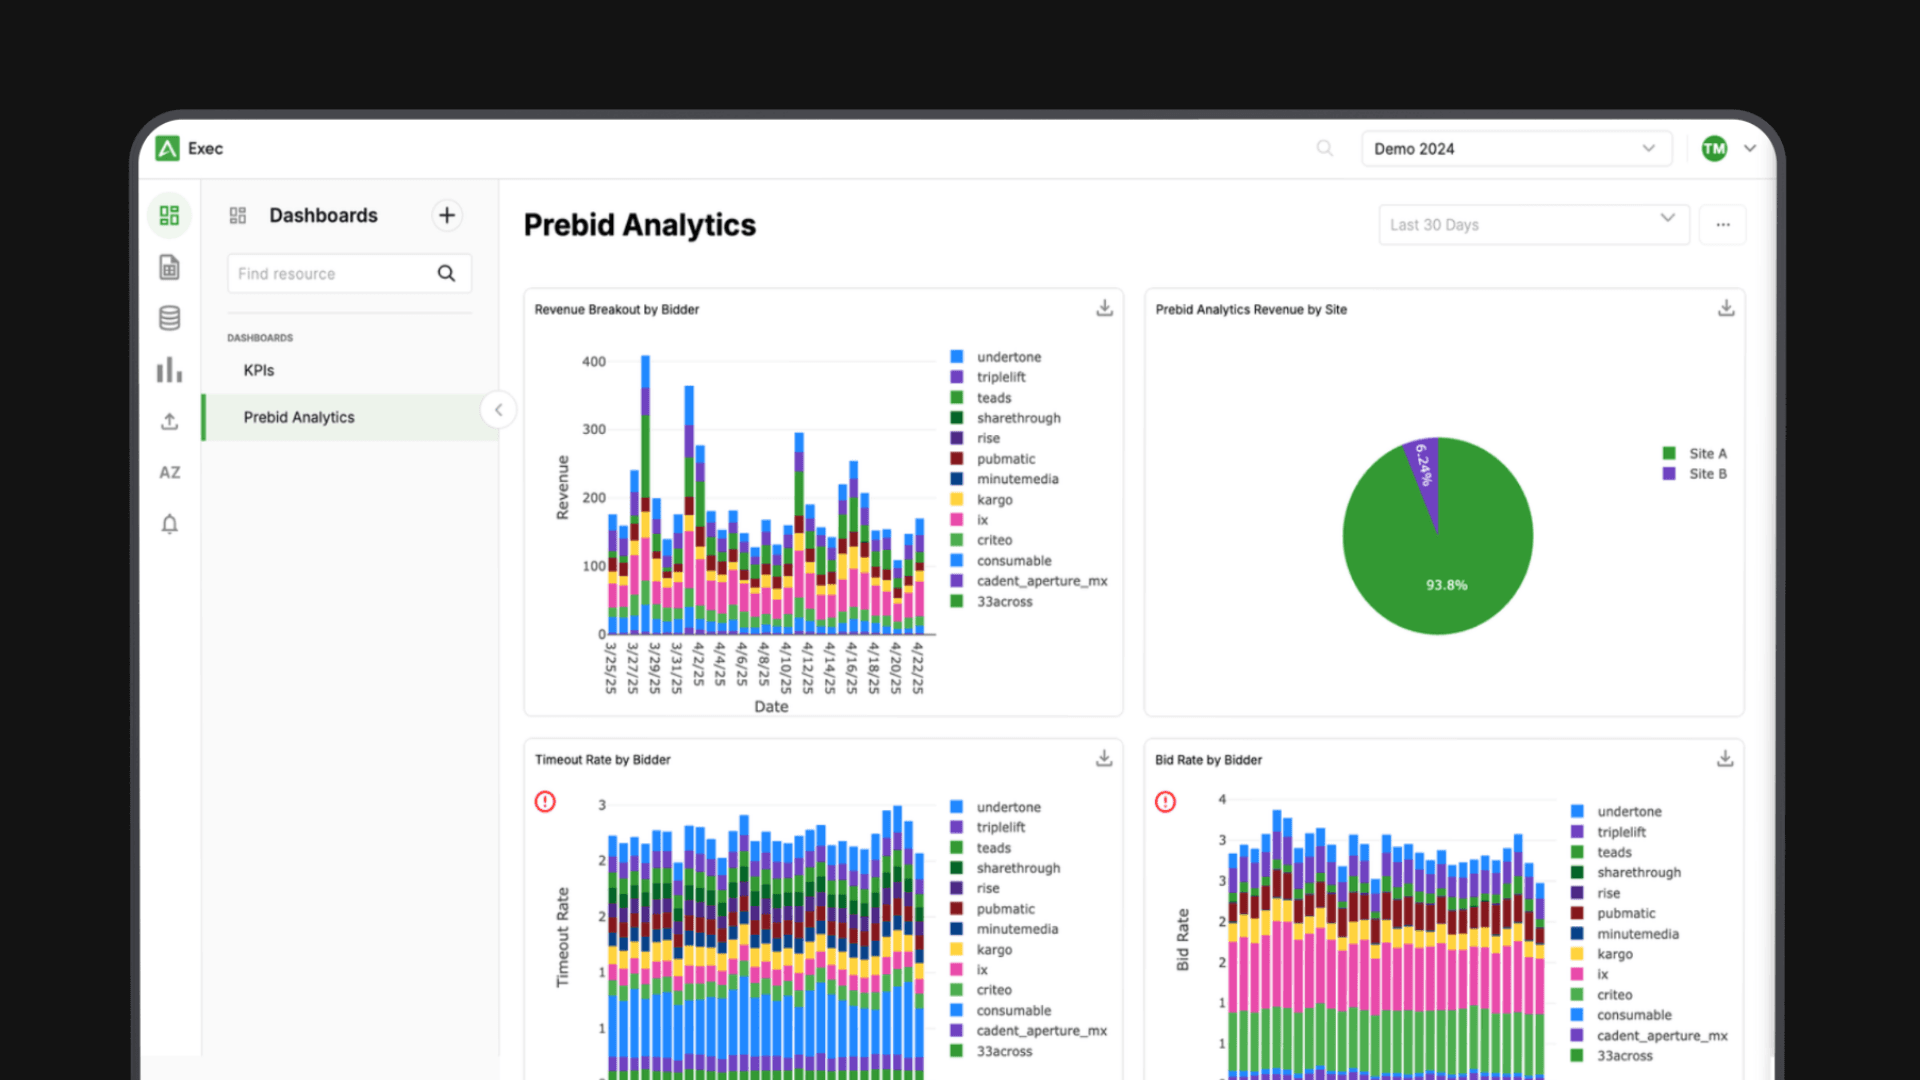
Unified analytics platforms pull SSP data into a single view with consistent definitions and shared dimensions. Aditude Insights surfaces bid rate, win rate, eCPM, response latency, and fill contribution across your entire demand stack in one place, so SSP comparison becomes a view rather than a project.
For a deeper look at the tradeoffs between unified reporting and individual SSP dashboards, see: Unified Reporting vs. Individual SSP Dashboards — What's the Difference?
The Repeatable Process
Pull normalized metrics (bid rate, win rate, eCPM, fill contribution, response latency) for the same time window and inventory segment across all SSPs
Apply revenue share normalization to get net eCPM
Flag SSPs against threshold benchmarks
Rule out seasonal, category, and geographic factors
Decide: optimize configuration, reposition in waterfall, remove, or monitor
If removing, run a controlled test first
Run this quarterly as a standard audit, and whenever a Tier 1 revenue metric moves unexpectedly.
Aditude Insights shows SSP performance side-by-side →
Compare bid rate, win rate, eCPM, and response latency across your full demand stack — without the spreadsheet.

